Intraday Donchian Channel Trading: A Simple Strategy
For day‑traders chasing a clear visual cue, Donchian channels can feel like a built‑in alarm system. When you combine them with tight intraday timeframes, the result is a surprisingly disciplined approach. Below you’ll find a step‑by‑step guide to using this tool without drowning in complexity.
What Are Donchian Channels?
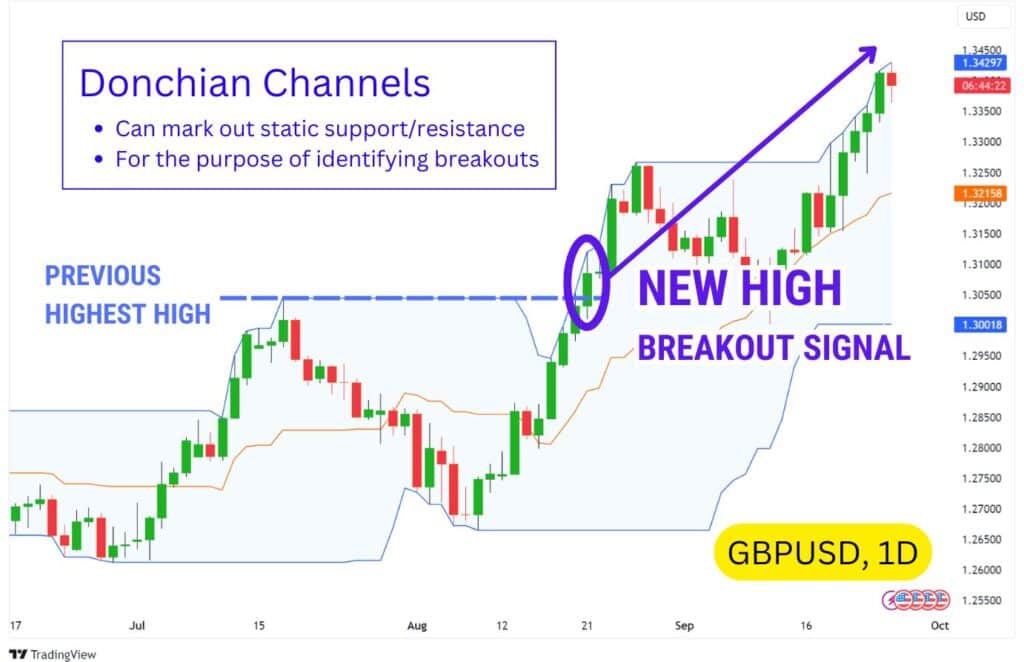
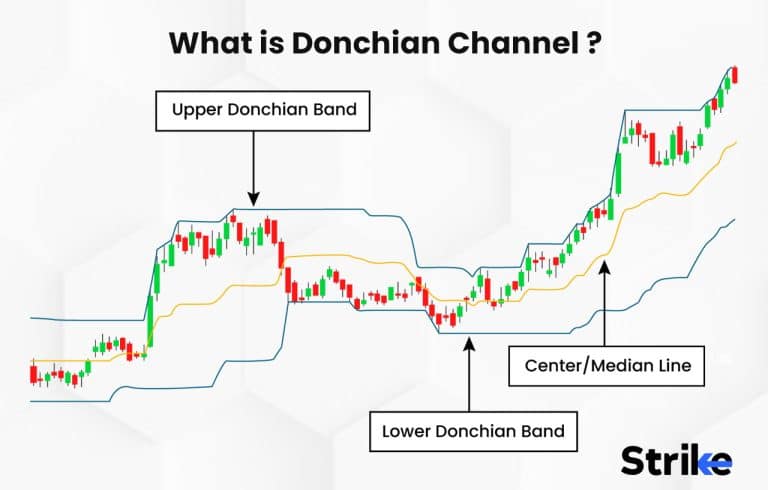
Created by Richard Donchian in the 1970s, the channels plot the highest high and the lowest low over a user‑defined period. The space between those two lines forms a channel that expands when volatility rises and contracts during quiet markets. A third line—often the median of the two—gives a quick sense of the prevailing trend.
Because the calculation is purely price‑based, the indicator reacts instantly to breakout moves, which is why many traders favor it for short‑term setups.
Why Use Donchian Channels for Intraday Trading?
Intraday trading thrives on clear entry triggers and swift exits. Donchian channels provide both:
- Breakout clarity. When price pierces the upper or lower band, it signals a potential directional shift.
- Dynamic stop‑loss levels. The opposite band serves as a natural place to park a protective order.
- Trend identification. A rising median line hints at bullish momentum; a falling one suggests the opposite.
These qualities line up neatly with the rapid decision‑making required when you’re holding positions for only a few minutes or a single session.
Setting Up Your Chart
Start with a 5‑minute or 15‑minute chart of the instrument you intend to trade—stocks, futures, or major forex pairs all work. Apply a Donchian channel set to a 20‑period look‑back; this is a sweet spot that captures the most recent price range without being overly sensitive.
Most platforms let you add a middle line (the average of the upper and lower bands). Keep it visible; it will act as a secondary filter for trend direction.
Entry Rules: Keep It Simple
The core of the strategy hinges on two conditions:
- Buy signal. Price closes above the upper Donchian band while the middle line is trending upward.
- Sell signal. Price closes below the lower band and the middle line is sloping downward.
Wait for the candle to close beyond the band to avoid false breakouts that often pop up on the first tick. Once the condition is met, enter a market order at the next price tick.
Exit and Stop‑Loss Management
Because intraday moves can reverse quickly, your exit plan should be as crisp as your entry. Two common methods work well:
- Trailing stop at the opposite band. If you bought, set a stop just below the lower Donchian line; if you sold, place it just above the upper line. As the channel widens, the stop moves with it.
- Fixed profit target. Many traders aim for a 1:1 or 1.5:1 risk‑to‑reward ratio, meaning a $100 risk would target $150 profit. Adjust the target to match the average range of the chosen timeframe.
Whichever method you prefer, stick to it consistently—changing rules mid‑session often leads to choppy results.
Risk Management Essentials
Even a simple system can bleed money if you overcommit. Here are three practical safeguards:
- Position sizing. Limit each trade to no more than 1‑2% of your total capital. For a $10,000 account, that’s a $100‑$200 risk per trade.
- Time filter. Avoid trading during the first five minutes after the market opens or the last five before the close; volatility spikes can cause erratic breakouts.
- News check. Scan an economic calendar for high‑impact events that could dwarf the channel’s range.
Applying these filters keeps the strategy’s edge intact and helps you stay emotionally neutral.
Common Pitfalls and How to Dodge Them
Beginners often mistake a brief price spike for a genuine breakout. Remember, the Donchian channel reflects the most recent high‑low range, so a single aggressive tick can trigger a signal that quickly fizzles. To reduce this risk, wait for a full candle close beyond the band and confirm the middle line’s slope.
Another trap is using too short a look‑back period. A 5‑period channel reacts to every little wobble, flooding you with false entries. Conversely, a 50‑period setting can lag behind rapid intraday moves. The 20‑period window strikes a balance, but feel free to tweak it after testing on a demo account.
Putting It All Together: A Sample Trade
Imagine you’re watching the 5‑minute chart of XYZ stock. The upper Donchian band sits at $52.30, the lower at $51.70, and the middle line has been nudging upward for the past 30 minutes. A candle closes at $52.35, breaching the upper band. You enter a long position at $52.36, set a stop just below $51.70, and target a profit of $53.00 (roughly a 1.5:1 reward‑to‑risk ratio). Within ten minutes the price climbs to $53.02, hitting your target, and you exit with a clean profit.
That’s the whole process: a clear visual cue, a disciplined entry, a logical stop, and a pre‑defined exit.
FAQ
Can Donchian channels be combined with other indicators?
Yes. Many traders overlay a short‑term moving average or an RSI to filter out weak breakouts. However, keep additional tools simple; the beauty of this strategy lies in its minimalism.
Is a 20‑period setting always ideal?
Not necessarily. The optimal look‑back length depends on the asset’s volatility and the timeframe you trade. Test 10, 20, and 30 periods on historical data to see which yields the highest win‑rate for your market.
How often should I revisit the strategy?
At least once a month, especially after major market events. Adjust position sizing, stop‑loss distance, or the look‑back period if you notice a shift in price behavior.
Do I need to trade every breakout?
No. Patience is part of the plan. If the middle line is flat or moving against the breakout direction, it’s wiser to skip the trade and wait for a clearer trend.